Improving indoor quality can save energy
Original Research by Vivian Loftness, Professor in the School of Architecture at Carnegie Mellon University
The next time your boss tells you your productivity is down, tell him it’s because you’re too uncomfortable in your work space. Use this article as evidence.
CBEI’s partner, the Center for Building Performance and Diagnostics (CBPD) at Carnegie Mellon, supported by the U.S. Government Services Administration – the United States’ largest property manager – is working on the WorkPlace 20•20/NEAT project to investigate the relationship of physical environment and building attributes to workers performance and organizational effectiveness [1]. The project is taking a three-pronged approach to evaluate indoor environmental quality (IEQ):
- observe the building systems in place (HVAC, windows, lighting, etc.);
- analyze occupant surveys; and
- measure the quality of indoor environment using the National Environmental Assessment Toolkit (NEAT).
The WorkPlace 20•20/NEAT study results yielded a set of best practice work strategies for energy savings and performance gains, which are described below.
National Environmental Assessment Toolkit
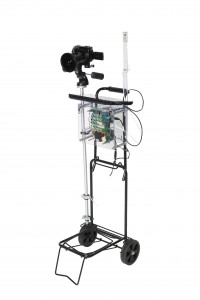
The NEAT instrument cart is a compact package for measuring all of the variables that determine an area’s indoor environmental quality and comes equipped with a data logger and a laptop.
The NEAT instrument cart measures:
- Thermal quality – air temperature at three heights (1.1m, 0.6m, 0.1m), relative humidity, radiant temperature asymmetry, and air velocity
- Air quality – CO2, CO, Particulates (PM2.5, PM10, Total Particulates), and Volatile Organic Compounds (VOCs), Radon
- Visual/lighting quality – illuminance, luminance, brightness contrast, and glareratio
- Acoustic quality – room noise level, noise criteria, speech privacy
All of the technology in the NEAT cart is off the shelf, mounted on a foldable luggage carrier, making it cost-effective and easy to replicate.
The toolkit has been beta-tested at more than 43 WorkPlace 20•20 workgroups in over 15 cities, representing over 6000 federal workers (occupants), 22 facilities, and 624 measured workstations. Studies were divided into workgroups based on size, orientation, and the following factors:
Background Information – Information obtained about the work group such as the mechanical systems in the space, occupant concerns, nature of work
Distance from the building perimeter – the workgroup is divided into perimeter zones (those that are adjoining an external wall, window, or have a seated view of the window), interior zones (those that have a view of the window from the adjacent corridor), and core (those that have no access to an external window)
Open vs. closed offices – In addition to zoning workstations based on location on the floor, offices are classified based on the partition type
Special function spaces – Conference rooms, kitchen areas, corridors, are considered separately
The NEAT cart is placed in the position of the occupant’s chair for approximately fifteen minutes for each workstation sampled. Hand-held readings of light levels, radiant temperature, and air velocity are logged into the data logger. Before leaving the room, two digital pictures are taken with a fisheye lens to capture brightness and contrast; and with a standard lens to record the workstation configuration, furniture, and primary work surfaces. While the physical measurements are recorded, the occupant is asked to complete a user satisfaction questionnaire related to that day’s specific environmental conditions as well as a questionnaire about conditions over the entire year.
Recommendations for Energy Savings and Workplace Performance Gains
The results from NEAT are compared to the prescribed standards for indoor environmental quality in commercial buildings, ASHRAE 55 and 62 (2010), in order to identify any indoor environmental factors that are not compliant with the standards. Analyzing those discrepancies against the survey results allows CBPD to advise the building owner/facility manager on how to retrofit and adjust building systems and space for optimal indoor environmental quality.
1. Lighting Retrofits
Replace antiquated lighting in federal facilities with lower level ambient lighting and high quality task lights for each desk. Also provide daylighting and seated views for the maximum number of workstations.
Benefits: energy savings; improved user satisfaction; improved task performance.
WorkPlace 20•20/NEAT revealed that replacing antiquated lighting with lower ambient lighting and high quality task lights for each desk, and maximizing daylight exposure for workstations can save a combined 279 million kWh/year for the GSA property portfolio [2].
Recommendations: Learn more about the costs and benefits of various lighting retrofit strategies.
2. Create Dedicated Copy Rooms
Create dedicated copy rooms instead of distributing printers and copiers in circulation aisles and at desks.
Benefits: reduced energy and paper consumption; improved air quality; improved interaction between employees
This change can save 50 kWh saved per employee per year or 55 million kWh/year across the entire federal portfolio [3]. For the 22 federal facilities sampled across the United States, the average number of printers and copiers in the federal workplace has risen to 1 per 5 workers. Although employers believe they are increasing efficiency by placing printers in or near workstations, the tradeoff for this perceived convenience is additional distraction, air quality issues and unnecessary energy demands. When centralized printers were installed, the walking distances barely increased from the 33 feet average for printers in circulation aisles, to 36 feet, showing that convenience was not compromised. Also, since centralized copy rooms require substantially fewer pieces of equipment overall, the equipment in these dedicated spaces can be of the highest quality in terms of speed, reliability, and material and energy conservation.
Recommendations: The rooms should be designed with acoustic separation, adequate layout and storage space, dedicated ventilation, effective lighting, and amenities that support interaction.
3. Replace Old Computer Monitors
Replace old CRT (cathode ray tubes) monitors with flat screen monitors of appropriate dimensions, and activate power management features.
Benefits: Energy savings; improved visual conditions
In comparison to CRT monitors, LCD screens do not flicker, offer uniform brightness, greater viewing area per inch of monitor, greater privacy for on-line work without polarizing screens, lower heat and noise output, and can be easily repositioned to fit user needs, freeing up valuable desk space. Older CRT monitors draw at least three times the energy of flat LCD screens, at 75 watts rather than 20-25 watts of peak energy on average [4]. Given that over 200,000 desktop monitors on federal desks are still deeper CRTs, 39 million kWh/year of federal energy would be saved by replacing old desktop monitors with new flat screen monitors. LCDs offer productivity improvements over CRTs with 22% faster visual search times for text targets and 22% improvements in reading speed and accuracy [5][6]. Reduced reflected glare on LCD screens results in less constrained worker posture, which leads to reduced muscular stress and possibly headaches [7].
Recommendations: Replacement monitors should be selected for daylight visibility, energy efficiency, and limited glare.
4. Raise Summer Temperature Setpoints
Have appropriate professionals raise indoor temperature setpoints to between 74 and 78°F (or an average of 2 degrees) in summer.
Benefits: energy savings; improved comfort
The California Energy Commission estimates energy savings of 1-3 percent for each degree the thermostat is set above 72 degrees. Prolonged use of economizer cycles may increase these savings further. With average US cooling loads for commercial offices at 2.65 kWh/square foot, raising temperatures 2 degrees Fahrenheit in federal facilities would save an average of 4% of total annual cooling energy or approximately 37 million kWh/year [8].
CMU’s CBPD found that 40 percent of the 300 workstations measured during the summer months were too cold given ASHRAE standards requiring temperatures 74°F and higher for summer clothing [9]. User Satisfaction Questionnaires revealed that 60 percent of occupants complain that summertime indoor temperatures are either slightly unsatisfactory, unsatisfactory, or very unsatisfactory. Studies have shown a drop in both occupant satisfaction and performance at tasks when temperatures become too hot or too cold for the seasonal dress [10].
Recommendations: Innovative engineering can negotiate the appropriate mix of outdoor air and return air to provide the most comfortable indoor temperature and humidity levels, the highest possible ventilation rate, and the lowest energy use. GSA will lead this effort by engaging ‘green’ mechanical engineers to develop solution sets for raising air conditioning set-points given the range of typical HVAC configurations in federal facilities. Summer dress codes should also be clarified so employees wear clothing that is appropriate to the season.
5. Increase Filter Management
Improve HVAC filter management.
Benefits: energy savings; increased user satisfaction
HVAC filters remove particulates from the air before they are distributed throughout the building and before they enter HVAC blower fans and other equipment. Occupants are significantly more satisfied with overall air quality condition when lower levels of particulates are present in the air. Given national averages for office energy use, energy savings for the federal portfolio should be over 24 million kWh/year with filter replacement programs [11].
Inadequately maintained filters can lead to energy costs 10 times higher than the initial filter price (for a standard pleated filter). The EPA BASE study of 100 federal buildings identified that almost 30% of federal buildings had infrequent inspection of HVAC filters (half year or more between reviews) [12].
Recommendations: An expert team should update performance specifications for HVAC filters on a regular basis to ensure that the most effective filters for particulate, VOC and other pollutants are utilized, with the lowest energy impact. The critical timing for filter maintenance and replacement needs to be updated in tandem with the performance specifications.
6. Replace Windows
Upgrade windows in federal facilities, especially if perimeter HVAC replacements are planned.
Benefits: energy benefits; improved thermal performance; ensured daylighting effectiveness
In addition to reductions in heating and cooling energy loads, window replacements will reduce drafts and noise, improve views and daylight, as well as support the potential of natural ventilation during the cooler months. If 70% of federal buildings are single glazed today, the heating and cooling energy loads at the perimeter can be reduced by 15.8 million kWh/year by retrofitting windows in 5% of federal facilities each year until the easier buildings are completed (given 22% of heating load due to windows and 32% of cooling load due to windows [13].
CBPD found that 14 of 22 federal buildings studied across the US (64%) are single glazed, and drafty. Over half have been retrofitted with solar film in an effort to cut down on solar gain, which also significantly compromises daylighting and views.
Recommendations: Comprehensive performance goals must be set for window replacements to ensure the highest level of daylighting, view and natural ventilation, alongside the highest level of thermal performance, air tightness, and solar shading. See tips for daylighting in the Research Digest piece about lighting retrofit strategies.
Other Recommendations
While CMU’s CBPD has identified impressive benefits to implementing the aforementioned six IEQ improvement strategies, CBEI researchers are working to show the benefits of others. Michael Waring, Associate Professor at Drexel University and CBEI Researcher conducts research on HVAC strategies, such as air flushing and using an air-side economizer, that lower energy use while simultaneously improving, or – at the very least – without harming IEQ. Waring’s most recent work has focused on demand-controlled ventilation (DCV), or dynamic modulation of the ventilation rate based on current occupancy. Waring, along with Adams Rackes found that, while DCV saved energy in offices, the average daytime concentration of VOC increased by 7-10% and peak VOC increased by 10-14%, depending on the environment of the city. Adding a medium intensity morning air flush to DCV almost completely mitigated the increase in mean concentration and reduced the peak concentration below the fixed ventilation baseline in most cases [14]. Waring is currently working on a cost-benefit analysis on implementing this technique.
Dr. William Bahnfleth, a CBEI Researcher, Professor and Director in the Indoor Environmental Center at the Pennsylavania State University and President of ASHRAE is currently researching the potential for ultraviolet germicidal irradiation (UVGI) of heating and cooling coils to improve system performance, indoor environmental quality, and energy savings. Cooling coils are perpetually wet throughout the season, creating a damp, dark environment that promotes bacterial growth. Bacteria on cooling coils can worsen system performance by reducing air quality, pressure drop and air transfer, unless the coils can be cleaned. Dr. Bahnfleth and his team at Penn State are working to measure the performance of UVGI to determine its lifecycle implications on a system: how the system uses energy; how much energy UVGI can save; and how airflow and pressure resistance impact energy use.
Bahnfleth’s team has begun baseline testing at sites in Tampa, Florida and Penn State’s University Park, and the team is currently assessing possible testing sites in the Philadelphia region. Microbiologists on the team collect samples of microorganisms present in the air and on cooling coils, and then test those samples after the UVGI system has been installed to determine if UVGI is an effective treatment. The UVGI lamp system used in this study is easily retrofitted into forced air HVAC systems, making the results of the study widely applicable. So far, models have found UVGI lowering energy use by 2-5%.
References
- Aziz, A., Loftness, V., et al. National Environmental Assessment Manual, Carnegie Mellon University.
- U.S. General Services Adminstration, Public Buildings Service, Office of Applied Science. (May 2003). Energy Savings and Performance Gains in General Services Administration Buildings: Seven Recommendations.
- U.S. Depart of Energy (DOE) (2008). Federal Energy Management Program (FEMP). http://www1.eere.energy.gov/femp/pdfs/printer.pdf.
- Lawrence Berkeley National Laboratory, Energy Use and Power Levels in New Monitors and Personal Computers (2002). http://enduse.lbl.gov/Projects/Of fEqpt.html.
- Naesaenen, R. (2001). Display Quality and the Speed of Visual Letter Search. Displays, v. 22 (4), pp. 107-113.
- Menozzi, M. (2001). CRT versus LCD: Effects of Refresh Rate, Display Technology and Background Luminance in Visual Performance. Displays, v. 22 (3), pp. 79- 85.
- Hedge, Alan. (May 2003) Ergonomic Considerations of LCD versus CRT Display. Cornell University. http://ergo.human.cornell.edu/pub/lcd_vs_crt_AH.pdf.
- Energy Informaton Administration (EIA) (2007). http://www.eia.doe.gov/emeu/con sumptionbriefs/cbecs/pbawebsite/office/office_howuseenergy.htm.
- ASHRAE 55-2004, Thermal Environmental Conditions for Human Occupancy.
- Center for Building Performance and Diagnostics (2008). National Environmental assessment Toolkit, Carnegie Mellon University.
- Energy Information Association (EIA) (2008). Commercial buildings energy consump tion survey (CBECS). http://www.eia.doe.gov/emeu/consumptionbriefs/ cbecs/pbawebsite/contents.htm#MajorFuelperSquareFoot.
- U.S. Environmnetal Protection Agency, Indoor Environments Division (2005). BASE Buildings HVAC Characteristics: Particle Filtration Systems – Frequency of Maintenance Actions for Different Configurations http://www.epa.gov/iaq/base/pdfs/ hvac_characteristics/bhc-9.pdf.
- U.S. Department of Energy (2008). Buildings Energy Databook 2007. http://build ings databook.eere.energy.gov.
- http://ac.els-cdn.com/S0360132312002788/1-s2.0-S0360132312002788-main.pdf?_tid=1840f6d4-507e-11e3-97a3-00000aab0f01&acdnat=1384799005_9ba49d2015f6ea1de438882e8ea07017